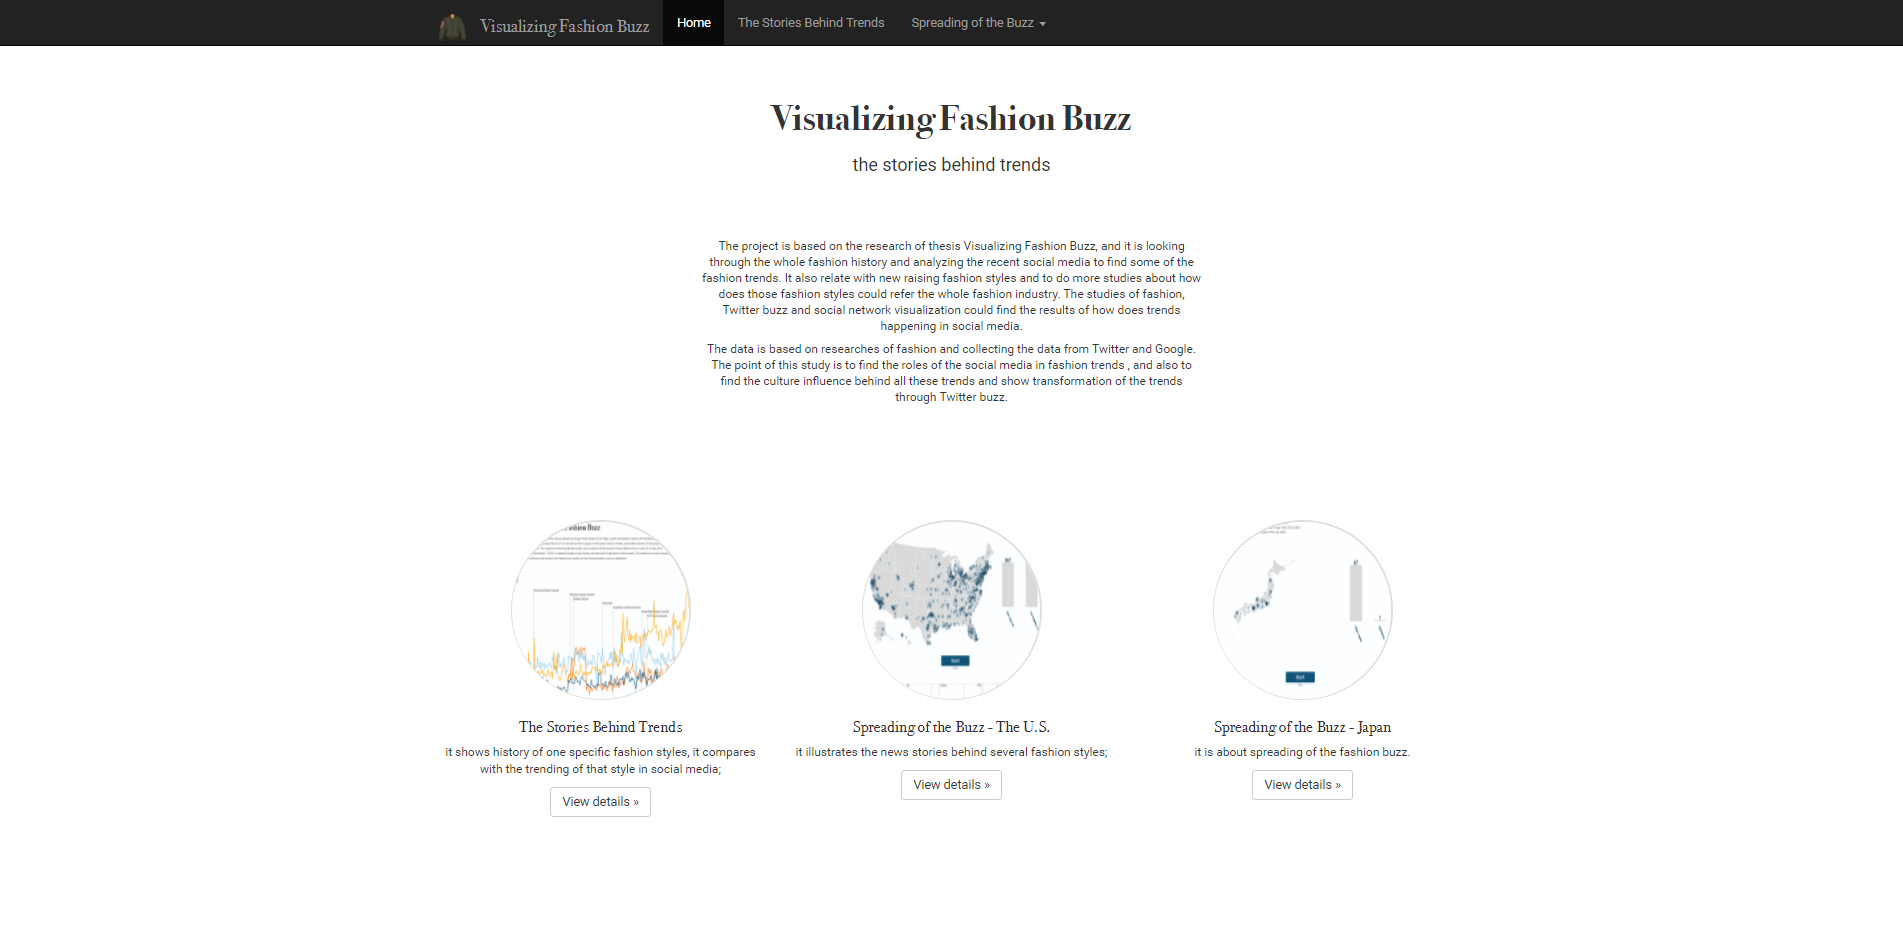
Trends on Twitter
Using more than 20k tweets data from twitter to analyze and using d3.js to make a website includes multiple ways(fashion map, line chart, word cloud, and related fashion news) to visualize how specific fashion trends on Twitter and also compared differences of the trends between U.S and Japan. (Co-op with Xinhe Yu)
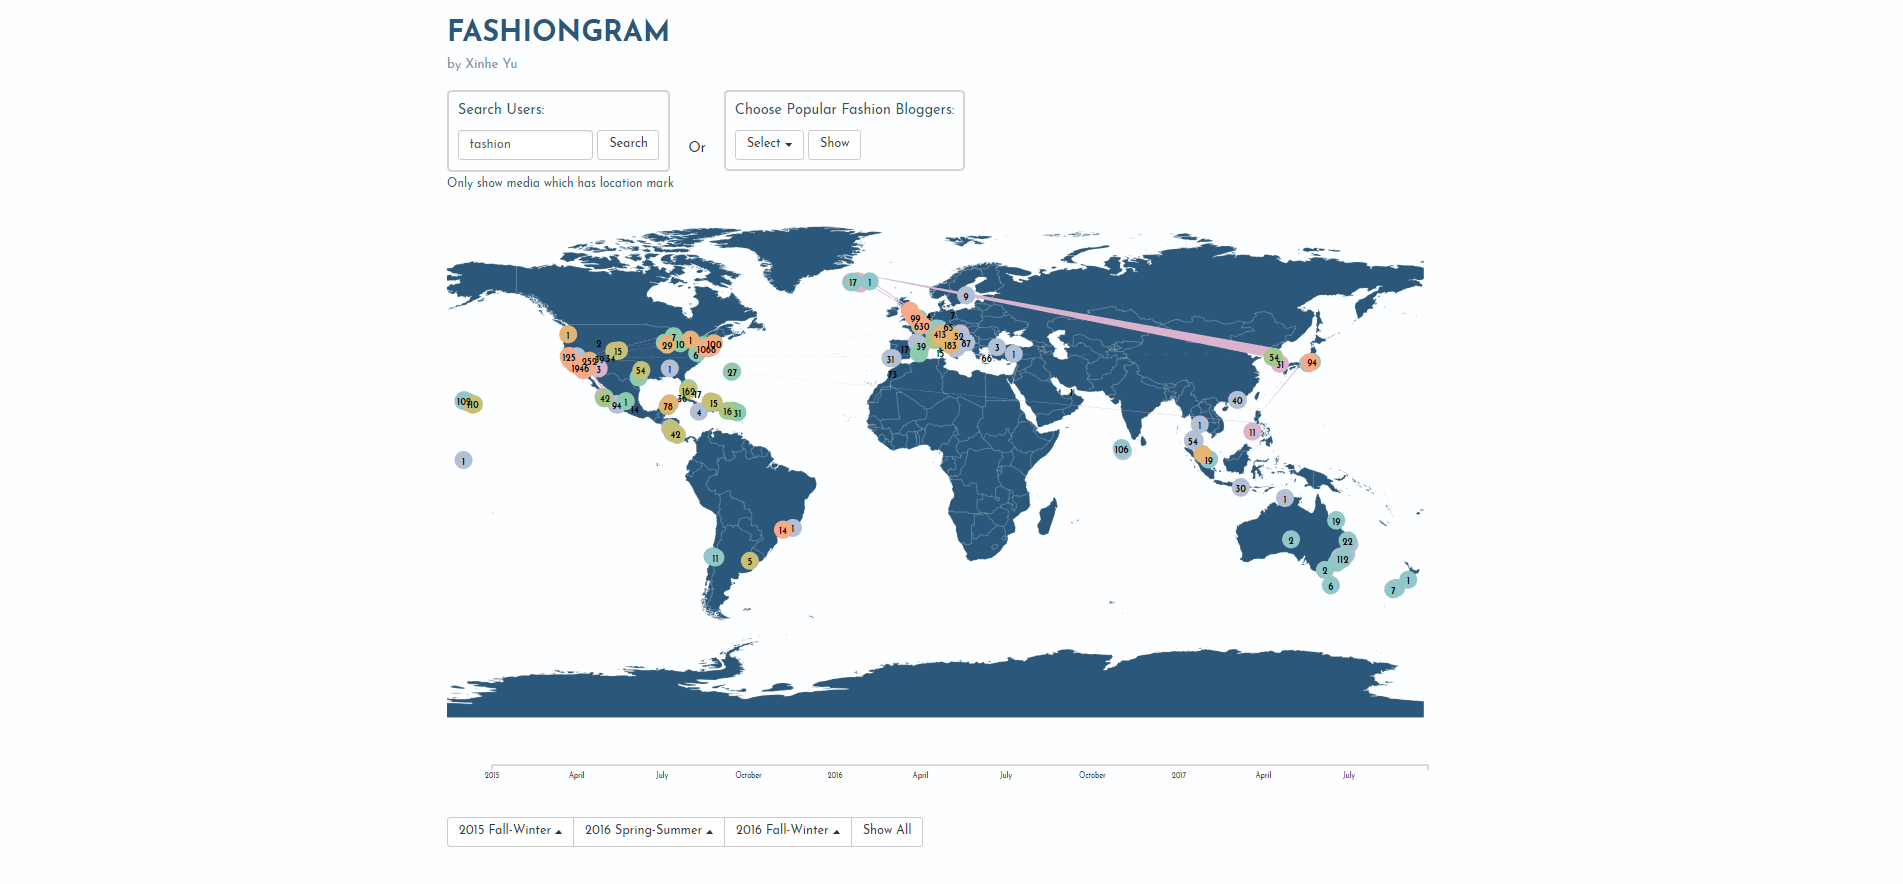
Fashiongram
This project shows world-wide famous fashion bloggers' posts during sevaral specific fashion weeks. Many interactive functions are designed to help user get more detail information. These bloggers' Instagram posts are displayed on the main map. Users could also use the timeline to filter posts by dates. (Co-op with Xinhe Yu)
Yawei Xue, 2017